FILING FOR HOMESTEAD EXEMPTION IN 2024
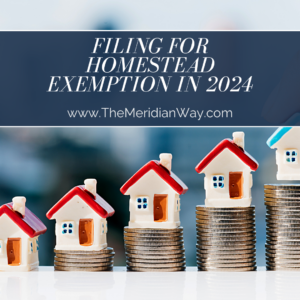 If you are filing for homestead exemption, homeowners may need to provide their Warranty Deed book and page, proof of residence, social security numbers, driver’s license, and car tag info. In most counties, to be eligible for the current year, you must have owned and occupied the property as of January 1st. If the property is located within city limits, the homeowner may be required to file with the city as well.
Bartow County – Click Here
Deadline : April 1, 2024 | 770 -387-5111
Cherokee County – Click Here
De ad line : April 1, 2024 | 6 78-49 3-6120
Cobb County – Click Here
Deadline : April 1, 2024 | 770 -528-8600
DeKalb County – Click Here
Deadline : April 1, 2024 | 40 4-29 8-4000
Douglas County – Click Here
Deadline : April 1, 2024 | 770 -920 -7272
Fayette County – Click Here
Deadline : April 1, 2024 | 770 -461-3652
Forsyth County – Click Here
Deadline : April 1, 2024 | 770 -781-2106
Deadline : April 1, 20 24 | 40 4-6 12-6 440
Gwinnett County – Click Here
Deadline : April 1, 2024 | 770 -822-8800
Deadline : April 1, 2024 | 770 -288-8180
Paulding County – Click Here
Deadline : April 1, 2024 | 770 -443-7581
This information was provided by one of our preferred closing attorneys Neel, Robinson, & Stafford, LLC. All rights reserved. NRS has multiple offices to choose from including Glenridge, Buckhead, West Cobb, Inman Park, Alpharetta, and Acworth.
For Additional Blog Content, Click Here!
Carbon Footprints and Construction: The Dilemma of Old vs. New Buildings
In order to stop climate change, the world needs to reduce the carbon emissions of our buildings. That isn’t up for debate. Reports have repeatedly shown that buildings, or more accurately, the people who use them, account for around 40 percent of the world’s carbon, making it all but impossible to reach our decarbonization goals without lowering their consumption. What still is up for debate is the best way to reduce the emissions associated with our existing building stock.
There are two options when it comes to making an older building more efficient: renovate or demolish and rebuild. The equation is pretty simple: if a new building can reduce its energy consumption enough to save more carbon over its lifetime than an older building, plus the carbon cost of construction, then it can make sense to demolish and rebuild. But as simple as that equation is in theory, it is very hard to calculate in the real world. What makes it so difficult is that we still don’t know exactly how much carbon is associated with every piece of building material and every building process. This is called “Scope 3” emissions, and while we do have ways to estimate it, it is still a bit of a guess. Making the right choice for whether to renovate or redevelop buildings is critical, and most scientists think that we have until around 2050 to decarbonize completely before we have irreversible and possibly catastrophic effects on the planet. However, getting the calculation right means having a better understanding of exactly how much carbon is associated with the construction process.
There are plenty of organizations that have attempted to calculate the sources of a building’s carbon footprint over its lifespan. The World Green Building Council estimates that of the 38 percent of the world’s carbon that buildings emit, 28 percent comes from operational emissions, 28 and 11 percent comes from its materials and construction. By that calculation, roughly 60 percent of a building’s emissions come from its operations and 40 from construction. There are other studies that estimate those numbers to be more like 80/20. If that is true, then you could certainly see why tearing a building down would be the best option, especially if a building outlives its estimated life of 50 years (which it almost always does).
But as hard as these studies try to make sure their calculations are as accurate as possible, the known unknowns have to cast some doubt on their viability. One of the biggest blind spots is how much carbon is associated with each building material. Some products do have what is called an Environmental Product Declaration, or EPD, that independently verifies the environmental impact of each product, but many still don’t. When it comes to more complicated products like fixtures or mechanical equipment, understanding exactly how much carbon they embody requires untangling the complicated web of the global supply chain. “We have a global market; we need international policy,” said Patrick O’Shei, Director of Market Development for NYSERDA, New York State’s Energy Research and Development Authority. NYSERDA was created by the State of New York to “reduce greenhouse gas emissions, accelerate economic growth, and improve the quality of life for all New Yorkers equitably.”
There is also a concern that some agencies, particularly governmental ones, might have an incentive to unfairly scrub their products clean. “Most of our concrete is locally sourced, but more than half the steel comes from China, and sometimes it is hard to trust their reporting,” said O’Shei. NYSERDA has worked hard to find places where building owners and developers in New York can find the most sustainable, often local resources, going as far as to find ways for materials to be brought into some areas like Manhattan by barge, a much less carbon-intensive transportation method than trucks.
It isn’t just governments that are suspect when it comes to accurate carbon accounting; certain large companies have plenty of reasons not to account for all of the emissions associated with their product. “There is pushback from certain industries,” said Ladan Ghobad, principal at ENERlite Consulting, a sustainability consulting firm that performs embodied carbon analysis for buildings. Tracking and reporting carbon emissions is not a priority for manufacturers such as concrete companies. Concrete has a significant carbon footprint, for about 8 percent of the global emission. “There are some new technologies that can lower the carbon created by the cement production process, but regulation and legislation are needed to push toward technological changes,” Ghobad said. She admitted that forcing large multinational companies with lots of lobbying power to change the way they do business will likely get pushback. She suggests inviting those companies to the table for discussion about improvement and legislative changes. This is what happened in California through continuous advocacy from AIA California. As of August 2023, California is the first state in the nation to adopt general code requirements for reducing embodied carbon in the built environment. As much as Ghobad would like to see buildings be built with less carbon, she also worries that too much change, too quickly, could spike the already spiraling costs of construction, “It is already expensive to build, so I personally don’t want to see too many added costs, especially for what it would do for affordable housing,” she said.
As critical as it is to get the rebuild versus renovate decision right, not having a perfect carbon accounting mechanism shouldn’t stop our efforts to understand the carbon associated with our buildings. Carbon Title is a company that is attempting to do just that; they have created a public database of the carbon footprint of every building in the country. I talked to the company’s founders, Trevor Dryer and Miles Haladay, who had a rather pragmatic approach to this problem. “If we try to track everything down to Scope 3 emissions, then no one will be able to report accurately,” said Dryer. Rather than start at Scope 3 for their database, they did their best to estimate both embodied and operational carbon based on local area averages. The software that they use can look at the size, structure, and usage of a building and estimate the carbon that would be needed to produce and transport the main components like steel, concrete, and glass to that area.
People can also “claim” their properties on Carbon Title’s database and add more specific data to refine the estimates. While Trevor and Miles hope that we can get more sophisticated in the way that we understand a building’s carbon footprint, they don’t think that it will sway our decision making too much. Instead, they had a clear vision for how we need to think about reducing the carbon in our buildings. “the biggest impact we can have is to upgrade our existing buildings. We need to start seeing their embodied carbon as an asset to be protected,” said Haladay. Even if some building owners do decide to go the demolish and rebuild route, Haladay doesn’t see that as the end of the world. “New buildings using low-carbon materials will also be needed to meet our climate goals, plus they can inspire us and show us what is possible.”
There is certainly a lot more work that needs to be done in order to understand the carbon associated with our built world. Until we do, it will be hard to know whether or not to try and upgrade our existing buildings or just knock them down and replace them with more efficient ones.
Thank you to Propmodo for this article. To read more, click here!
For Additional Blog Content, Click Here!
How much do you need to earn to afford a $500,000 home? Here is the answer.
 For an individual earning the median income, homeownership is increasingly out of reach
The Next Surprising Fractional Ownership Trend: Student Housing
 Once considered a niche asset class, student housing is quickly becoming a darling for commercial real estate investors. Even institutional players have been eyeing dollar signs in the last several months. Last August, Blackstone Properties bet big on student housing when it completed its acquisition of American Campus Communities Inc., the largest publicly traded owner and developer of student housing in the U.S. As an asset, student housing tends to do considerably well during depressed economic periods, and since there’s an overwhelming consensus from both policymakers and real estate executives that a recession is poised to jump out any minute now, the interest isn’t all that surprising. What is surprising, though, is how technology and regulatory frameworks have enabled new forms of student housing ownership, putting student housing on the forefront for fractional ownership.
Fractional ownership, where multiple investors collectively own a single property or a portfolio of properties, is not a new concept in real estate. The idea led to the creation of REITs in the 1960s. While REITs are fund based, a public market version of fractional ownership, a private version has emerged as well. Thanks to new regulations around investment offerings, a number of sites have sprung up giving access to individual investments in properties without having to deal with issuing stock to the public. These options have gained popularity in recent years as a means for non-accredited investors to gain exposure to the real estate market without having to fork over huge amounts of capital. This new way for “retail” investors to find and invest in larger properties might change the competitive landscape for the student housing sector.
Unlike retail, office, or industrial properties, student housing didn’t traditionally offer the same shine as an investment hedge, for both institutional and fractional investors. For one thing, student housing properties are often smaller and less visible compared to office buildings or shopping centers, making it difficult for institutional investors to allocate large sums of capital to them. Also, students tend to be cost conscious so the returns may not have been significant enough to justify the investment. Student housing is also subject to more seasonal fluctuations than other types of real estate, with high demand during the academic year and lower demand during summer months. This created additional challenges for investors, as they needed to carefully manage their rental income and occupancy rates to ensure steady returns. In recent years, the student housing market has become more institutionalized, with larger investors, REITs, and private equity firms investing in the sector. This has led to increased capital allocation, more professional management practices, and greater scalability in the market.
Confidence in the student housing market has swelled. A recent report from JLL revealed that transaction volumes shattered records at the end of 2022, and the momentum was so strong that it nearly doubled from the year prior. “The fundamentals of student housing have never been stronger, which is why capital is flocking to the asset class,” said the firm’s Capital Markets Student Housing Team in a statement. Those fundamentals include increased demand as college enrollment bounces back from the pandemic slump, potential for higher returns as many areas around universities have constrained construction, and a stronger guarantee compared to other multifamily assets (remember that parents are often co-signers). “Many investors consider student housing recession-proof as every lease has a parental guarantee,” added the report.
Student housing concluded its best year on-record in 2022, but the hype for student housing as an investment only grows when you look at 2023’s pre-leasing momentum. A first-quarter report from Yardi Matrix shows that leasing for the 2023 school year is “proceeding at an impressive clip.” Institutional investor interest in student housing is slated to grow even more as interest rates settle down, which market watchers are anticipating will happen sometime this year. But where institutional investors go, individual investors tend to follow.
Amidst the onset of the COVID-19 pandemic and the economic panic that followed, serial entrepreneur Qian Wang had a lightbulb moment. “I wanted to democratize investing in real estate, and I knew that student housing is a safe investment, especially during an economic downturn,” said Wang, “because people go back to school to improve their job prospects or they recharge and decide to change their profession.” He told me that the main thing that had given so many investors pause to put their money towards student housing was because of the dense operational requirements to manage each property. In order to disrupt the traditional paradigm of student housing, technology would have to play a vital role.
In 2020, Wang founded Collabhome.io (“Collab”), a decentralized property management and investment platform. Collab recently qualified its first investment offering under Regulation A+ with the SEC which allows every U.S. resident 18 years of age or older to invest as little as $500 in one of their student housing projects. As of now, Collab is one of the first to open up fractionalized ownership to off-campus housing, but considering the meteoric growth the sector is expected to undergo, it’s not unlikely that other fractional platforms might catch on.
Whether investment is coming from institutional players like Blackstone or retail investors, increased investor interest signals that student housing is niche no more. However, the introduction of fractional ownership options also suggests that there is a growing market demand for this type of investment structure, which may be driven by changing attitudes towards real estate investment and the availability of new investment platforms and technologies. Overall, the ingress of fractional ownership in student housing reflects a shift towards more accessible and inclusive investment opportunities in the industry.
Can Office-to-Residential Conversions Be Done at Scale?
 One of the most common things I hear these days when talking about empty office buildings from people outside of the industry is “they should just turn them into apartments.” It makes sense, why let office buildings sit with so few occupants when many cities are in the middle of a housing shortage? But for most office buildings, it’s not that simple. Granted, office-to-residential conversions can be very successful. In 2020 and 2021, more than 13,000 apartment units were created as result of office conversions across the country, especially in the cities of Arlington, Virginia, Washington, D.C., and Chicago, according to RentCafe. But in most cases, a building that’s a candidate for a conversion needs to check off a lot of boxes before a developer is able to take the plunge, and in a lot of major cities around the U.S., not many buildings fit the bill.
But that doesn’t mean cities aren’t trying. In places like Washington, D.C., Chicago, and Calgary, city officials have launched incentive programs to help developers create needed housing out of vacant office buildings in central business districts. All three cities have areas where older Class B and Class C buildings are posting low occupancy rates, and that’s something both office owners and city leaders don’t want to see happen. Empty office buildings can turn into blight, causing nearby retail to struggle and an overall negative effect on the surrounding neighborhood.
Making plans
Calgary, the largest city in the Canadian province of Alberta, is undertaking the most ambitious office-to-residential conversion plan of probably any city in the world. It’s a city that is known for being the capital of the country’s oil industry and for its abundance of downtown skyscrapers, which all together total 45 million square feet of office space. Unfortunately, many of those towers have been empty for the last several years.
Calgary’s Director of Downtown Strategy, Thom Mahler, said at the WRLDCTY (sic) conference in Manhattan earlier this month that the city’s office problems began well before the pandemic. In 2014, when Calgary went through an oil bust, companies left downtown office buildings in droves, causing the CBD to lose a “massive” workforce. As a result, the city lost $16 billion in property value after the crash, and the city’s government decided something had to be done. Officials ended up partnering with Gensler and were able to zero in on 14 million square feet of office space that could be converted into residential buildings, something Mahler called a “huge leap of faith.” The city rolled out a $100 million development incentive program that triggered a huge amount of interest in the real estate community, and so far, five projects have been approved to go forward.
Chicago city officials are looking to tackle the vacant office problem too. Mayor Lori Lightfoot recently announced a plan to help developers finance conversions of offices in the city’s LaSalle Street corridor into residential buildings. The city said it would provide tens of millions of dollars in subsidies to help revitalize the area, which houses several landmark office buildings in downtown Chicago. The corridor has the highest vacancy rates in the city’s downtown and has struggled with occupancy since the onset of the pandemic. With the new program, the city is aiming to create 1,000 apartment units in the program’s first phase, many of which will be designated affordable. “There is nearly 5 million square feet of vacant commercial space on the LaSalle Street corridor, but not a single unit of affordable housing,” Lightfoot said in a statement announcing the plan.
In Washington, D.C., where the office vacancy rate reached an all-time high of nearly 20 percent this summer, city leaders are also looking to convert empty offices into housing. The city announced an effort to look more closely at these kinds of conversions late last year, in a bid to see how feasible it was to do more conversions at scale to help revitalize struggling areas downtown. Since then, the city included tax abatements for conversions to housing in the downtown core in its 2023 budget proposal. Like many other cities around the country, the city needs more housing built. D.C.’s Mayor for Planning and Development explained that downtown needs more housing in order to keep up with newer neighborhoods. “We need to do it to save downtown,” he said. “The only way to do that is to have a better mix of uses.”
Problems to solve
But will these city programs be enough to help find a way to utilize the currently vacant office buildings? “Absolutely,” said Jeffrey Havsy, an analyst at Moody’s Analytics. “That’s going to be needed going forward. We’re going to need public-private partnerships to get over these hurdles.” Havsy recently studied the office-to-residential conversion trend and outlined the challenges faced by developers looking to turn office buildings into other uses in his analysis. Using New York City as a case study, Havsy found that only about three percent of the 1,100 office buildings in the city Moody’s tracks have the characteristics needed to be a viable residential conversion, the vast majority of which are class B or C office properties.
One of the biggest issues is the size of a building’s floor plates. Office buildings tend to have larger floor plates that only allow a limited amount of natural light within interior offices and storage rooms. In apartment buildings, unit depths usually max out around 40 to 50 square feet. If an office building has deep floor plates beyond 100 or 120 square feet wide, they won’t make a good conversion candidate. Another is ceiling height. For office buildings, desirable ceiling heights are much higher than for residential buildings. When Gensler undertook a study of office-to-residential conversions, the firm found that typical Class C building ceiling heights are around 12 feet, a figure considered “oppressively low” for offices, but one that is thought of as “luxurious” in an apartment building. Zoning is also a major factor in a potential conversion, and can limit what a developer can do by adding parking and other requirements, and even if rezoning is an option, it’s often a lengthy process.
Brad Hargreaves, the founder of General Assembly and co-living firm Common, said one of the biggest hurdles for developers looking at conversions doesn’t have anything to do with cost or floor plate sizes. “I think one of the biggest challenges these projects face is getting them to feel residential, because an office building has a very different look and feel than a residential tower,” Hargreaves said. He gave the former WeLive community at 110 Wall Street in Manhattan as an example of what can happen with these conversions, “you still had to walk through office turnstiles to get there, and that doesn’t feel residential, that doesn’t feel like home.” He pointed to building details like lighting, materials and exteriors, which can say a lot about whether the building is a workplace or a place to live.
NYC-based Metro Loft is a developer that has been successful with multiple office-to-residential conversions it has completed. One of those, 180 Water Street in Lower Manhattan, was a building that wasn’t an ideal candidate for conversion and had deep floor plates and lacked natural light and air for what would be interior apartments. To get around the issue, the company carved out a 30 by 40-foot courtyard right into the center of the building. By doing that, Metro Loft was then able to add additional penthouse apartments to the roof of the 24-story tower and still maintain its floor area ratio, or FAR. The developer is currently working on converting another Lower Manhattan building, 55 Broad Street, into luxury apartments. Built in 1967, the building has larger floorplates, inoperable windows, and facades that will have to be completely overhauled, according to architect Nancy Ruddy, whose firm is working with Metro Loft on the project. She compared the conversion project to a ‘puzzle’ with ‘problems to solve.’
Despite all the efforts being put toward converting office buildings to housing, office-to-residential conversions may continue to be a minor trend, unless office building values and office rent prices experience a significant, permanent decline. Until then, many of the conversions that do take place will end up as luxury apartments or condos instead of affordable housing. However, there are some reasons to be optimistic about the potential for more conversions to pencil. “People who do this on a regular basis are becoming much more efficient at it,” Moody’s Havsy said, adding that he is seeing more reuse and repurposing of materials on projects.
Transforming vacant offices into housing will continue to be something that cities and developers pay attention to closely, especially with more cities looking to public-private partnerships to get conversions like these done at scale. As designers and developers get more savvy in finding solutions to common obstacles, it will hopefully lead to more innovation that will help get projects done faster and at a lower cost. There’s still a lot of room for innovation in the office-to-residential niche, and it could be what’s needed to turn the minor trend into a major one.
Thank you to Propmodo for this article. To read more, click here!
For Additional Blog Content, Click Here!
Is Recycled Plastic the Next Big Sustainable Building Material?
 Plastic tends to have a bad reputation, and for good reasons. The ubiquitous material is one of the leading causes of pollution worldwide, with the vast majority of the material not recycled, according to the National Resource Defense Council. It’s used in almost everything we use daily, from electric vehicles to toys to floor rugs. Single-use plastic, however, poses the biggest threat to the environment, and many initiatives are taking place to mitigate that. One of the biggest ways the problem is being tackled is through more plastic waste reuse, including as a building material. Using alternative materials in development projects is almost everywhere at the moment. Industry players, both big and small, increasingly use alternative materials like mass timber and bamboo in their projects. Choosing options outside of traditionally-used materials like steel and concrete is not only eco-friendly, it’s a way for companies to achieve green standards and ESG goals and construct something visually distinctive.
The omnipresent nature of plastics means there is an ever-growing mountain of plastic waste being generated around the world, and some countries are exploring ways to reuse it. In Europe, a circular economy for plastics has been studied extensively. Plastics Europe, an industry group for the continent’s plastics manufacturers, is aware of the harm the products can and have caused the world and are trying to mitigate it by encouraging more reuse. In a recent report, the organization found that the use of recycled plastics in buildings and construction worldwide is growing. In fact, 45 percent of post-consumer recycled plastics are used in some capacity in building and construction. The report also found that the percentage of recycled plastics being used in new products rose from 7.2 percent in 2018 to 8.5 percent in 2020. In that same time period, the amount of recycled plastic used in building and construction increased 16.5 percent. For example, plastic waste can be used to make green concrete, a more environmentally-friendly concrete that uses waste and leftover materials from various industries and requires less energy.
While it’s still an emerging concept, plastics have a lot of promise for building construction. Plastics have qualities that make them a good candidate for construction. The material is waterproof, corrosion-resistant, durable, and effective as an electric and thermal insulator. While plastic has a lot of qualities that make it ideal for construction use, it’s still not as strong as wood and steel and doesn’t have the same load-bearing capacity. It also wouldn’t work well for things like drilling and nailing due to its texture. That’s why it needs to be mixed with other materials. Mixing plastic with other materials has been considered as a way to decarbonize the concrete manufacturing process, which produces significant amounts of carbon dioxide. In one study, MIT students mixed gamma radiation-exposed plastic powder into cement paste, which ended up creating a finished product that was 15 percent stronger than standard concrete and more durable to boot.
Other research has explored using recycled plastics in the brick-making process, which also requires high energy to produce. In one experiment, stacking recycled plastic bricks like LEGO blocks was proposed, with one Colombian company manufacturing the bricks for single-family homes that could be built for just over $5,000. What’s more surprising is that recycled plastics have also been added to lumber to create something called structural plastic lumber; made from recycled milk containers and coffee cups, among other recycled plastics material, the hybrid lumber was described as “lighter than steel, longer-lasting than lumber, and strong enough to support 120-ton locomotives.”
In Germany, recycled plastic played a big part in a 13-story mixed-use building in the city of Mannheim developed in 2019 by the German developer and builder Diringer & Scheidel Group. Using a patented void former system from the company Henize Cobiax Deutschland that uses steel-reinforced plastic air bubbles in slabs, the firm could avoid using 1,778 tons of concrete and 149 tons of CO2 emissions. The project achieved a green certification from Germany’s Green Building Council for using the void formers. Back in 2020, a design studio created a structure for an annual festival celebration in Hong Kong that marked the country’s first large-scale architecture project made using recycled plastic bricks. The bricks were created using the recycled plastic material high-density polyethylene.
In another example, a California-based startup that builds 3D-printed homes partnered with the real estate company Reinhabit to build a series of tiny homes made from recycled plastic. More than 60 percent of the printing material used to build the ten homes, located in three different locations in Southern California, is recycled plastic. The company, Azure Printed Homes, is using post-industrial plastic but is looking to use post-consumer plastic for future projects. “Our supply chain should never be short in our lifetime,” said Azure co-founder Ross Maguire.
A polymeric materials scientist from Brazil who has been researching plastics for years is a big believer in the future of plastic waste used for building materials. His team has been in the process of developing a building block made of recycled plastics and other waste-stream materials like sawdust, hemp, red mud, and concrete waste. “Plastics are strong, durable, waterproof, lightweight, easy to mold, and recyclable,” said Sibele Cestari. “All key properties for construction materials.” While there are promising applications, so far, they haven’t been reproduced at any large scale. Cestari believes it will take “political will” and more awareness of the benefits of using recycled plastic instead of mining natural resources to draw more investment into the initiative.
In the US, big efforts are being made by the Department of Energy (DOE) to reduce the amount of plastic waste and increase the recycling rate. Last year, the DOE announced $13.4 million in funding for technologies that will help reduce the amount of single-use plastics by designing new plastics that are more recyclable and biodegradable. Several months after the announcement, researchers at Oregon State University made a breakthrough that could greatly expand the range of plastics that can be recycled. It’s difficult to tell yet whether using recycled plastics in real estate development would cost less than traditional materials, though some companies in the plastics industry say it is more affordable. One plastics industry association said that plastic lumber, made with a combination of recycled plastic, wood fillings, and “wood-like properties,” if used at scale, could help bring down the rising cost of homebuilding in the US.
With the staggering amount of plastic waste that continues to be generated around the world today, using it as an alternative, sustainable material for building and construction seems like a no-brainer. However, it’s still pretty early in the research and prototyping process, so it will likely be some time before we see more widespread use of plastic waste in major real estate projects in the US. There will also need to be a lot more investment into recycling waste that is typically ruled out during the recycling process, which would open up a wealth of products that could be used in creating construction materials. But as research continues and the number of projects using recycled plastic grows, as well as efforts being undertaken at the federal level to increase recycling rates, things are looking good for both supply and demand of the alternative building material.
Thank you to Propmodo for this article. To read more, click here!
For Additional Blog Content, Click Here!
When the Economy Rebounds, Will Developers Be Ready?
 Almost every business is watching the economic news right now, looking for signs of the impending recession. But even though almost no business is immune to a recession, the effects of it are felt differently in different industries. Real estate developers, for example, have a unique view of recessions. Their projects take months to plan and years to complete, so the effects of a recession take a while to trickle down into their day-to-day. This lag time plays in their favor at the beginning of a recession but can come back to hurt them when conditions turn around. How developers plan around downturns can help them avoid canceled projects when times are bad and take advantage of the growth that inevitably follows.
No two recessions are alike, but that doesn’t stop people from comparing them to each other. This time around, people are looking for parallels to the last recession in recent memory, the great financial crisis (GFC) of 2008. But this recession is very different for a lot of reasons. The economic landscape following the GFC left an incredible number of homeowners with more loans than their homes were worth, leading many of them into foreclosure or to be sold at a loss. The shock to the financial system caused massive layoffs and left many speculating that it could take decades to recover. In response, federal banks around the world slashed their interest rates to historic lows, but even that didn’t give many property investors confidence to continue with their projects.
This recession is quite different. Rather than happening overnight, like the GFC, this current downturn has come on slowly. Instead of homeowners finding themselves with underwater properties, this time around, commercial building owners are facing high vacancies and are having a hard time refinancing. The great recession took everyone by surprise, but people have been predicting this current downturn for years.
Developers that hit pause on their projects when alarm bells of the recession sounded might have missed out on a few good years of growth. That has left many of them with much more reason to continue with their projects. “We are not stopping because we want to be ready,” said Jay Stark, Principal at The Pinyon Group. His projects are in California, a state with one of the longest permit and entitlement processes, which also gives his team another reason to keep projects going. “For certain projects, the planning phase might outlast the recession, so there’s no reason to table them,” he said. “Plus, even if we don’t think it is feasible to do the construction part of a project, we could always just sell the entitled land to someone else who might be able to make it work.”
Another unique aspect of this recession is the high-interest rate environment that it has caused, but even that is not enough to derail most projects. “We got almost all of our financing done in 2022, so we are able to ride this out with what we have,” Stark said. “Other projects in the future might be harder to make pencil, but that really depends on the property type.” For example, the Pinyon Group does a lot of affordable housing projects, and according to Stark, those investors are more worried about tax incentives than interest rates.
Recessions do put most investors on high alert. This means that developers have to be extra diligent when communicating with investors during downtime. “It depends on the project, but most of them, we have investor meetings every week,” said Stark. Partially thanks to the pandemic, there are a number of tools available to help developers with those regular touchpoints. The ability to easily share and collaborate over documents and plans has empowered virtual meetings in a way that was never possible before.
Another peculiarity of the current economy is the tight labor market. The talent shortage, especially in a specialized, technical field like development, can often mean high turnover. The churn of employees is easier to deal with when developers are able to stay organized. Here is another place where developers have a growing number of options to help them collaborate efficiently on one system of records.
Right now, many investors are saving their money and waiting for opportunities. “Most of us thought that things were overinflated before, so if you were patient, it is kind of nice to see things come back down to earth,” said Stark. Eventually, though, things will start to look up, and when they do, developers will have to be ready. That means not only having financing and contractors in place but being able to easily pull data together for analysis. The ability to find and use real-time market data, like construction costs in a particular market, can help developers make smarter decisions, but they are only useful if the process is speedy enough to be actionable. To ensure that they will be ready for the surge of activity once the economic situation does recover, developers can use this downtown to learn a number of new tech platforms available to them that can do anything from making your historical project data searchable and organized in dashboards to automating low-level admin tasks that help you keep headcount at more manageable levels.
So far, this recession seems like it has been a long time coming. Even as inflation and interest rates started rising, asset values stayed stubbornly high. We seem to finally be easing into the downturn, but that doesn’t mean something won’t happen to accelerate it. “What I worry about is what I have never thought or heard about,” said Stark. Developers everywhere are hoping for the best but planning for the worst since either seems just as possible. By staying nimble and adopting good tools and processes, developers will be ready for a bounceback, a catastrophe, or anything in between.
Thank you to Propmodo for this article. To read more, click here!
For Additional Blog Content, Click Here!
FILING FOR HOMESTEAD EXEMPTION IN 2023
 Homeowners may need to provide their Warranty Deed book and page, proof of residence, social security numbers, driver’s license and car tag info. In most counties, to be eligible for the current year, you must have owned and occupied the property as of January 1st . If the property is located within city limits, the homeowner may be required to file with the city as well.
Bartow County
Deadline: April 1, 2023 | 770-387-5111 | Bartow County – Click Here
Cherokee County
Deadline: April 1, 2023 | 678-493-6120 | Cherokee County – Click Here
Cobb County
Deadline: April 1, 2023 | 770-528-8600 | Cobb County – Click Here
DeKalb County
Deadline: April 1, 2023 | 404-298-4000 | DeKalb County – Click Here
Douglas County
Deadline: April 1, 2023 | 770-920-7272 | Douglas County – Click Here
Fayette County
Deadline: April 1, 2023 | 770-461-3652 | Fayette County – Click Here
Forsyth County
Deadline: April 1, 2023 | 770-781-2106 | Forsyth County – Click Here
Fulton County
Deadline: April 1, 2023 | 404-612-6440 | Fulton County – Click Here
Gwinnett County
Deadline: April 1, 2023 | 770-822-8800 | Gwinnett County – Click Here
Henry County
Deadline: April 1, 2023 | 770-288-8180 | Henry County – Click Here
Paulding County
Deadline: April 1, 2023 | 770-443-7581 | Paulding County – Click Here
This information was provided by one of our preferred closing attorneys Neel, Robinson, & Stafford, LLC. All rights reserved. NRS has multiple offices to choose from including Glenridge, Buckhead, West Cobb, Inman Park, Alpharetta, and Acworth.
For Additional Blog Content, Click Here!
Here Are the U.S. Cities Where Home Prices Rose—and Fell—the Most in 2022
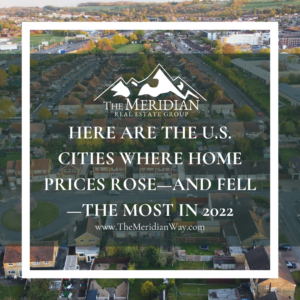 By any definition, 2022 was one wild, white-knuckle roller coaster of a year for real estate. Demand and home prices hit new highs, before abruptly turning in the opposite direction in response to higher mortgage interest rates.
With so much churn and fluctuation in markets across the U.S., it’s been a challenge all year to keep track of which places were up and which were down—the cities where prices remained near their peak and where they dipped the most. That’s why Realtor.com® crunched the numbers to come up with the definitive home pricing scorecard for 2022.
And there’s plenty at stake. For those who purchased a home earlier this year, the dip in prices in some areas could mean their home is worth less now than what they paid. For those who were priced out of homeownership, the same price declines could mean a renewed chance to finally snag a place.
And where prices remain high, those who have owned for more than a couple of years can revel in the mighty home equity they’ve gained. Those still looking for a home in the same areas will feel the pressure of high home costs.
What the numbers reveal is not a huge surprise, especially in the list of the metro areas that have fallen in price the most.
“It’s a who’s who of cities that became popular during the [COVID-19] pandemic,” says George Ratiu, Realtor.com® senior economist and manager of economic research. “These are destinations for people who were fleeing high-cost urban cities.”
Now, those areas are seeing prices that had risen the most coming back down to Earth.
“It’s the natural reaction to the sharp run-up in prices over the past couple of years now meeting the new, higher mortgage rates this year,” Ratiu says.
As for the markets that have held on to their price increases, Ratiu says they all have something in common: They’re all historically affordable locations, mostly in the middle of the country.
“They offer home buyers a lot of value,” says Ratiu.
They likely also benefited from another dynamic at play during the pandemic era: a spillover effect from markets that were hottest during the same period, but which now see prices plateauing or falling.
To determine our rankings, we looked at the year-over-year change in the median price per square foot for the 100 largest metro areas in the country on Realtor.com, from mid-December 2021 to mid-December 2022. Then we pulled out the five markets with the biggest year-over-year increase and the five markets with the biggest decrease. We limited our rankings to only the single largest increase and decrease per state, in order to ensure geographic diversity. (Metros include the main city and surrounding suburbs, towns, and smaller urban areas.)
Biggest price increases of 2022
1. Omaha, NE

Year-over-year change in price per square foot: +21.6%
Mid-Dec. 2022 median listing price per square foot: $181
Mid-Dec. 2022 median listing price: $342,500
Omaha has the biggest year-over-year price gains of any place on the list, rising from the median of $149 per square foot to $181. However, even with the 20%-plus increase in prices in just one year, it’s still relatively affordable compared with the rest of the country. Prices are about 15% below the national average of $212 a square foot.
Nebraska’s largest city by far is home to several Fortune 500 companies, including Warren Buffett’s international holding company, Berkshire Hathaway. The area is also known for its low cost of living, vibrant music scene, and world-class zoo and aquarium.
Omaha is also halfway between Denver and Chicago and, Ratiu says, is a prime example of how midsized cities in the Midwest benefited from their proximity to larger places, especially those that had become frenzied markets during the pandemic.
“The markets where the most people were looking at home
 Sold
Sold Active
 Expired
 Sold
Sold Expired
 Expired
 Active
 Active
 Sold
Sold Sold
Sold Expired
 Sold
Sold Sold
Sold Expired
 Sold
Sold Withdrawn
 Sold
Sold Expired
 Sold
Sold New
New Active
 Sold
Sold Leased
 Sold
Sold Sold
Sold Active
 Pending
 Sold
Sold Active
 Sold
Sold Expired
 Sold
Sold Sold
Sold Sold
Sold Sold
Sold Sold
Sold Withdrawn
 Expired
 Sold
Sold Sold
Sold Sold
Sold Sold
Sold Sold
Sold Sold
Sold Sold
Sold Sold
Sold Sold
Sold Sold
Sold Sold
Sold Sold
Sold Sold
Sold Sold
Sold Sold
Sold Active
 Sold
Sold Sold
Sold Sold
Sold Leased
 Sold
Sold Sold
Sold Sold
Sold Pending
 Sold
Sold Sold
Sold Sold
Sold Pending
 Sold
Sold Sold
Sold Sold
Sold Pending
 Sold
Sold Sold
Sold Sold
Sold Sold
Sold Sold
Sold Sold
Sold Sold
Sold Sold
Sold Sold
Sold Sold
Sold Pending
 Sold
Sold Sold
Sold Sold
Sold Sold
Sold Sold
Sold Sold
Sold Sold
Sold Sold
Sold PendingPendingPending
 Sold
Sold Withdrawn
 Sold
Sold Sold
Sold Sold
Sold Sold
Sold Leased
 Sold
Sold Sold
Sold Sold
Sold Sold
Sold Sold
Sold Sold
Sold Sold
Sold Sold
Sold Sold
Sold Sold
Sold Sold
Sold Sold
Sold Sold
Sold Sold
Sold Sold
Sold Sold
Sold Sold
Sold Sold
Sold Sold
Sold Sold
Sold Closed
 Sold
Sold Sold
Sold Sold
Sold Sold
Sold Sold
Sold Sold
Sold Expired
 Sold
Sold Sold
Sold Sold
Sold Sold
Sold Active
 Sold
Sold Sold
Sold Expired
 Sold
Sold Sold
Sold Sold
Sold Sold
Sold Sold
Sold Sold
Sold Sold
Sold Sold
Sold Sold
Sold Sold
Sold Sold
Sold Sold
Sold Leased
 Sold
Sold Leased
 Sold
Sold Sold
Sold Sold
Sold Sold
Sold Sold
Sold Active
 Sold
Sold Pending
 Sold
Sold Leased
 Closed
 Leased
 Leased
 Leased
 Leased
 Expired
 Active
 Active
 Active
 Active
 Sold
Sold Leased
 Leased
 Leased
 Leased
 Leased
 Leased
 Leased
 Leased
 Leased
 Leased
 Expired
 Expired
 Withdrawn
 Expired
 Expired
 Expired
 Expired
 Sold
Sold Expired
 Sold
Sold Sold
Sold Expired
 Expired
 Expired
 Withdrawn
 Expired
 Expired
 Sold
Sold Sold
Sold Sold
Sold Expired
 Expired
 Expired
 Expired
 Expired
2. Jackson, MS

Year-over-year change in price per square foot: +21.6%
Mid-Dec. 2022 median listing price per square foot: $144
Mid-Dec. 2022 median listing price: $316,000
Jackson led the Deep South in year-over-year appreciation, rising more than 20%—but it’s still more than 30% below the national average.
Prices rose in the capital of Mississippi throughout the year, with a small dip in the middle of the year. It ultimately ended the year almost tied with Omaha for the biggest year-over-year increase in price per square foot.
This iconic Southern city has several fundamental strengths that add to its draw. In addition to being the capital of Mississippi and the seat of state government, it’s also home to Jackson State University and the University of Mississippi Medical Center, as well as a strong manufacturing industry. It’s also a hub of Southern culture, and the area is filled with antebellum mansions and historical sites.
For $320,000, home hunters can get a midcentury four-bedroom home in the Belhaven neighborhood, north of downtown Jackson, or a sprawling, ranch-style home farther in the Jackson suburbs.
3. Wichita, KS

Year-over-year change in price per square foot: +21.5%
Mid-Dec. 2022 median listing price per square foot: $135
Mid-Dec. 2022 median listing price: $289,900
Wichita, known as “The Air Capital of the World,” is the least expensive location on the list—a boon for buyers on a budget. The median listing price per square foot was more than 35% below the national average. And that’s after median listing prices rose by $60,000 over the past year.
Wichita is known for its aviation industry, with aerospace companies Learjet, Cessna, and Airbus located there.
The city offers a mix of the walkable urban center, with the Old Town entertainment district at the center, and lots of outdoor lifestyle activities, like hiking and biking, or getting out on the Arkansas River.
Buyers can find updated, three-bedroom, two-bathroom houses on almost a half-acre for just under $230,000. Or they can pick up a smaller, two-bedroom, one-bathroom house for about $135,o00.
4. Milwaukee, WI

Year-over-year change in price per square foot: +20.9%
Mid-Dec. 2022 median listing price per square foot: $204
Mid-Dec. 2022 median listing price: $374,900
An anchor of the Midwest, Milwaukee, located on the shores of Lake Michigan, has the highest median listing price per square foot of any city on the biggest-increases half of the list. But it’s still about 4% lower than the national figure. And with a median listing price of $374,900, Milwaukee is still cheaper than what buyers will find in much of the rest of the country.
The city is known for its breweries and as the birthplace of the Harley-Davidson Motor Co. Motorcycle enthusiasts can visit the Harley-Davidson Museum and check out Elvis Presley’s own rides.
For right around Milwaukee’s median home price, shoppers can get a Victorian four-bedroom home in the Bay View neighborhood, walking distance from the Lake Michigan shore.
5. Little Rock, AR

Year-over-year change in price per square foot: +20.1%
Mid-Dec. 2022 median listing price per square foot: $142
Mid-Dec. 2022 median listing price: $299,900
Arkansas’ capital, Little Rock, rounds out the biggest-increases list, still with more than 20% listing price per square foot gains over the past year.
Little Rock is home to the Clinton Presidential Center, the Arkansas Arts Center, and the Old State House Museum, the oldest state capitol building west of the Mississippi River. It’s also an educational hub of the South, with the University of Arkansas at Little Rock and Philander Smith College.
There was some homebuying spillover from nearby markets that became overheated during the pandemic, says Melanie Jackson, the broker and owner of Unlimited Properties Realty in Little Rock.
“People who would not normally have considered buying in or investing in Little Rock were gobbling things up. They were buying everything they could,” she says. “It was nice, as a listing agent, but hectic—and it was tough on the buyers.”
While the sustained higher prices mean equity gains for owners, Jackson says it’s been tough to watch as locals have been priced out, or priced out of what they wanted.
Biggest price decreases of 2022
1. Boise City, ID

Year-over-year change in price per square foot: -5.8%
Mid-Dec. 2022 median listing price per square foot: $263
Mid-Dec. 2022 median listing price: $509,900
Boise was one of the hottest markets during the pandemic as an influx of former Californians moved in and builders rushed to put up more homes. List prices rose more than 70% between the beginning of 2020 and the middle of 2022.
The skyrocketing prices in Boise reflected the surge in demand for places that offered affordability, relative to big coastal metropolitan areas that many buyers were moving from.
Realtor.com economist Ratiu says it’s no surprise to see Boise leading the country in price declines since hiked interest rates put the brakes on the market.
“The run-up in prices in a place like Boise, where there was such an inflow of new buyers, was tremendous, [especially] when you look at the size of the market or the local incomes,” Ratiu says. “The prices were out of alignment.”
Many sellers have been forced to reduce their asking prices to attract buyers—a big departure from a year ago. The percentage of homes in the metro with price cuts were up 100.9%. The sellers of this updated, three-bedroom, two-bathroom house cut the price $56,000 to $449,000 since it went on the market in late November.
2. Denver, CO

Year-over-year change in price per square foot: -5.7%
Mid-Dec. 2022 median listing price per square foot: $280
Mid-Dec. 2022 median listing price: $599,990
The Mile High City’s mile-high prices have come down some, as this pandemic destination’s red-hot market cools off.
Like Boise, Denver attracted a lot of newcomers who were fleeing urban areas that made Denver’s already above-average home prices look affordable. A perk for buyers were that the city and state are known for some of the lowest property taxes in the nation. That helped to keep monthly mortgage payments more manageable.
Home prices in Denver surged about 35% between the beginning of the pandemic and early in 2022. But like in other cities, home prices began to fall, and now are almost 6% below last year.
For around $600,000, home shoppers can find a two-bedroom bungalow built in 1905 in Denver’s coveted Highlands neighborhood.
3. Sacramento, CA

Year-over-year change in price per square foot: -3.1%
Mid-Dec. 2022 median listing price per square foot: $328
Mid-Dec. 2022 median listing price: $591,500
California’s capital of Sacramento is the most expensive metro on the list, with homes around 50% above the national average.
However, it’s long been known for a relatively low cost of living and more relaxed lifestyle, compared with San Francisco, about an hour and a half southwest, where the median home list price in the metro was over $1 million in November.
Those lower prices in Sacramento helped the city to attract Californians fleeing higher prices in the Bay Area who could suddenly work remotely. That helped to give prices a hefty boost.
Prices rose more than 35% between the beginning of 2020 and mid-2022. But the real estate market has since cooled as higher mortgage rates have changed the affordability equation.
For just under $600,000, home shoppers can find a small, two-bedroom home in Sacramento’s Marshall School neighborhood, east of the Capitol Mall city center.
4. New Orleans, LA

Year-over-year change in price per square foot: -2.7%
Mid-Dec. 2022 median listing price per square foot: $179
Mid-Dec. 2022 median listing price: $325,000
The Crescent City is the only Southern metro on the list of price declines, with prices down around 3% year over year.
That’s after prices in New Orleans went up around 30%. Home insurance costs in and around the storm-prone Big Easy are expected to rise in 2023, and the pandemic real estate frenzy has died down, helping to bring down prices.
Median listing prices in New Orleans are still about 15% below the national average. And for about the metro’s median price of $325,000, shoppers can find a three-bedroom home in the Central City neighborhood, southwest of the city’s famous Canal Street.
5. Chicago, IL

Year-over-year change in price per square foot: -1.6%
Mid-Dec. 2022 median listing price per square foot: $188
Mid-Dec. 2022 median listing price: $320,000
Chicago is the most populous metro on the list, and the one with the decline closest to flat for the year. That more modest home pricing decrease is a function of the Second City’s size and diversity, according to Nancy Nugent, the global real estate adviser and senior vice president at Jameson Sotheby’s International Realty.
“Chicago fares better because we have so many industries and multiple economies,” Nugent says.
Despite the modest declines, Nugent says she is still seeing plenty of activity in Chicago’s real estate market. It’s still relatively affordable compared with many other large cities.
“We’re climbing out of the COVID era, and people are coming back to the city,” she says. “There’s a real resurgence right now.”
Chicago home shoppers can get a two-bedroom condominium for around $320,000 in the city’s famous Lincoln Park.
Thank you to Realtor.com for this article. To read more, click here!
For Additional Blog Content, Click Here!
New Standards Aim to Make Building Construction Less Wasteful
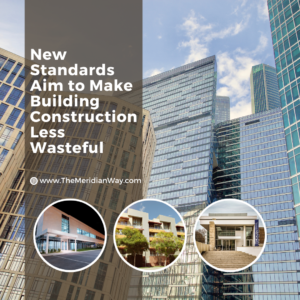 Much of the talk about green buildings centers on operational energy consumption and, increasingly, carbon emissions. But there are many aspects of sustainable commercial buildings, and one that’s garnering more attention lately is the massive amount of waste generated during construction and demolition. The statistics are eye-popping when you take a closer look. Construction and demolition in buildings, roads, bridges, and other sectors generate more than 600 million tons of waste annually in the U.S., according to the EPA. That’s twice as much waste as what municipalities collect from homes and businesses in cities.
About 100 billion tons of raw material is extracted from the earth every year, equivalent to destroying two-thirds of Mount Everest’s mass annually. Approximately half of that raw material goes into building construction. It’s estimated that construction creates a third of the world’s overall waste; unfortunately, much of this waste ends up in landfills. More building owners are tackling the construction waste problem as it becomes incorporated into increasingly stringent green building standards.
One example of a building using new techniques to cut down on construction waste is the Kendeda Building for Innovative Sustainable Design at the Georgia Institute for Technology in Atlanta. The building earned the Living Building Challenge (LBS) certification in 2021 which is known by many as the most rigorous and ambitious green building standard in the world. The Kendeda Building is just one of 28 buildings globally that have achieved it and the first in the Southeastern region of the U.S. One of the ways the building garnered the certification was by eliminating more than 99 percent of its construction waste and incorporating reclaimed materials into the project.
Skanska, the world’s 5th largest construction company, served as the project manager for the Kendeda Building’s construction, and they had their work cut out for them in reducing waste according to the Living Building Challenge requirements. Under LBC, building projects must incorporate one salvaged material per 500 square meters of gross building area. That meant 10 salvaged materials for the Kendeda Building, many of which had to be locally sourced. Nearly all waste from the development had to be diverted from landfills, including 99 percent of metal, 99 percent of paper and cardboard, and 100 percent of soil and biomass.
Before construction began, Skanska’s team compiled a list of expected waste streams from each trade. All the salvageable material was either incorporated into the development or donated to the Lifecycle Building Center in Atlanta, which captures building materials from the waste stream and directs them back to the local community for reuse. About 443 tons of asphalt were recycled from the project, and the construction team prevented about 99.5 percent of scraps and unused materials from being turned into waste.
The Skanska team also got creative in the use of salvaged materials. They set aside a small warehouse about 1.5 miles from the construction site where they were able to stockpile salvaged building materials, including slate tile that was removed from a Georgia Tech campus building. Granite from the campus’ Archives Building was used for landscaping the building site, and storm-fallen trees were collected, milled, and dried for counters and benches. The project team removed 1880s heart pine joists from a campus building to use as stair treads.
Meeting all these waste reduction requirements was far from easy, requiring constant vigilance until the project was done. Plenty of material still had to be hauled away from the site despite the reuse of soil, logs, and lumber scraps. Sending building materials to recyclers was a last resort. The recycling effort required massive sorting and tracking, and the changing cast of subcontractors had to get used to this novel way of doing things. Most construction sites use one bin for waste and one for mixed recycling, but the Kendeda Building had recycling bins for gypsum, metals, paper, insulation, and wood.

Shan Arora, the Director of the Kendeda Building, told me that a big part of designing this ultra-sustainable building was to be an example and roadmap for other U.S. commercial green buildings, especially in the Southeast. While net-zero waste efforts were challenging and even frustrating sometimes, the idea was to look at building materials differently and perhaps influence other building owners to do so. “We wanted to change how buildings are thought about,” Arora told me. “My goal is to push people with their building projects to think beyond what their building can be.”
Waste diversion and reduction are just one of the many impressive aspects of the Kendeda Building. The building is an example of regenerative design, an increasingly popular architectural concept that goes beyond mere sustainability and aims to be self-sustaining and produce net-positive environmental impacts. The Kendeda Building’s energy-efficient electrical and mechanical equipment, tight building envelope, and solar panel canopy supply 225 percent of the building’s energy needs annually. The solar panel canopy on the roof also captures rainwater. The water is then stored in a 50,000-gallon cistern in the basement, treated, and used for all building purposes, including drinking.
While the Kendeda is impressive and has won multiple awards, not all new building projects have the capital and funding to meet these standards. The building is about 13 percent more expensive than a comparable building at Georgia Tech at $544 per gross square foot. The Georgia Institute of Technology also received a $30 million grant from the Kendeda Fund to build the state-of-the-art green building. It was the biggest donation ever given by the Kendeda Fund and the largest one ever received by the Georgia Institute of Technology. The building was explicitly designed to meet the Living Building Challenge 3.1, and $25 million of the donation was used in construction, with the remainder set aside to support programming activities.
Arora frequently gives tours of the Kendeda Building to architects and building owners seeking to learn what’s behind their accomplishments. He said numerous building projects in the Southeastern U.S. have been inspired by the building, but he acknowledged other projects have more limitations. “I say to building owners, you have to deliver something without the foundation funding that we have,” Arora said.
The circle of (building) life
While not every building developer will have the wherewithal to create something like the Kendeda Building, there are still ways to reduce and divert construction waste from landfills, many of which are attributed to the idea of a ‘circular economy.’ The circular economy concept means replacing waste systems that extract resources with a circular system that keeps products and materials reused. In construction, the idea places value on building material waste as a commodity and not something to be just tossed aside. The cycle recovers and restores materials through re-use, repair, and re-manufacturing. This is what the Kendeda Building accomplished by following the Living Building Challenge certification guidelines, and while other building projects don’t have to aim for that high of a goal, they can still incorporate circular economy practices.
Using circular economy practices in building construction and demolition first means reducing the volume of new materials used. That means preserving existing buildings and prolonging their life. Salvaging and re-using materials have already been a part of building construction, but new ways of re-purposing materials are being considered. Tracking waste from building sites more closely is essential, and separating the waste and transporting it to the correct and certified recycling facilities for processing is the next step.

A prime example of circular economy practices in building construction is the Catherine Commons Deconstruction Project, a collaborative effort with the Circular Construction Lab, a nonprofit organization, and the architecture firm Trade Design Build. The project centered on developing 300 new housing units near the Cornell University campus in Ithaca, New York, which required the demolition of 11 early 20th-century residences. The team convinced the developer to salvage nonstructural elements from 10 demolished buildings and completely deconstruct the other building.
During a week in January 2022, eight workers meticulously cut the roofs, walls, and floors into sections, loaded them onto a truck, and delivered them to a local warehouse for processing. After processing, more than 50 community members and smaller contractors have purchased the salvaged materials, including structural timber and oak flooring. It’s estimated that the structural timbers salvaged from the deconstructed house equated to more than 13 tons of embodied carbon being diverted from a landfill.
Gensler is another firm that has taken the lead on the construction circular economy, applying the principles to the interior design of Google’s $2.1 billion office headquarters project at St. John’s Terminal in Manhattan. The building has been partially fitted out with recycled construction waste, such as scrap gypsum board, diverted back to the manufacturer, and then re-purposed as new gypsum board products. Gensler says that as of April 2022, the project’s interior design had used about 200 tons of recycled materials.
Barriers to overcome
While approaches like this show promise, barriers to the widespread use of circular economy practices in building development persist. The biggest one is economic. Deconstruction of buildings to gather salvageable materials is more expensive than standard demolition, as it demands more time and labor. Typical demolition practices focus on the fastest and most efficient way to get the job done, and the challenges of recovering materials during deconstruction aren’t appealing to most contractors.
Disposing of building materials in landfills is also faster and cheaper than diverting them to warehouses to be salvaged. Building construction for developers is often all about getting the job done quickly, and extra time leads to additional costs. During a time of rising building materials prices and other costs for contractors from supply chain problems and labor shortages, any extra costs added to development aren’t welcome.
Transitioning to a circular economy in building construction is also a significant culture change for developers and property owners. Consumerist societies, especially in the U.S., see waste as inevitable, and many may even have a bad image of salvaged materials. It’s like getting second-hand clothes from your sibling, right? While some developers may embrace this thrift-store mentality, it’s easy to see how many in America are attracted to new and shiny things, including when they think about commercial buildings.
Reducing construction waste can work in the commercial real estate sector, but it’ll take time for concepts like the circular economy to sink in. Many building contractors are reluctant to change and don’t want to modify the usual way of doing business. For most building developers, unfortunately, it’s about getting jobs done ‘quick and dirty.’ Pressure from state and local building regulations and codes may push the ball forward, and the stricter standards for waste conservation in popular green building certifications like LEED will apply pressure, too. For example, LEED 4.1 standard has several credits geared toward construction and demolition waste management. As more tenants today demand green-certified buildings, this could push developers and owners to tackle construction waste more.
Any progress toward reducing building construction waste is welcomed because materials waste has become a growing and massive global problem. According to the EPA, construction and demolition waste generation in America increased by 342 percent between 1990 and 2018, and there’s little sign of slowing down. On a global scale, waste of all kinds is predicted to increase by 70 percent by 2050 if action isn’t taken, according to the World Bank.
Cutting-edge regenerative buildings like the Kendeda Building are an example of new developments that can reduce construction waste streams substantially, even though not all contractors and developers can meet that high standard. Real estate developers will not be able to reduce construction waste overnight. Incremental improvements to the process can be a goal and another essential aspect of pushing the real estate industry to greener and more sustainable standards.
Thank you to Propmodo for this article. To read more, click here!
For Additional Blog Content, Click Here!
Despite Market Turbulence, Industrial Real Estate Will Continue To Boom
 There has arguably never been a more robust year for industrial real estate.
Construction companies completed 121.4M SF of industrial in Q3 2022, the second-highest quarterly total on record. Demand has more than kept up, and vacancy rates trended downward for the seventh straight quarter to a record low of 3.3%.
Though macroeconomic instability is affecting all aspects of commercial real estate, industrial space has proven to be a resilient asset class. However, no sector comes without its challenges.
Rising interest rates, pandemic-induced supply chain setbacks and inflation are worrisome to CRE professionals. As many believe the market is on the brink of a recession, the Federal Reserve announced another interest rate hike in mid-December, elevating rates to the highest they’ve been in 15 years. Labor shortages, material scarcity and price increases are also contributing factors to today’s industry concerns.
As the industrial sector navigates the challenges of a world changed by the pandemic, CRE firms have had to adjust their business strategies accordingly. Taking that into account, CORFAC International — a worldwide network of independently owned commercial real estate firms — expects to see continued strength into 2023.
“While activity may have cooled off slightly from earlier this year, industrial real estate is still in strong demand,” said Mason Capitani, managing partner of L. Mason Capitani/CORFAC International and 2022 CORFAC International president. “Though economic conditions are turbulent right now, professionals in the industry are proving to be adaptable and forging new industry trends.”
One way industrial professionals have been adapting to current supply and demand conditions is by searching for less-conventional spaces.
“Companies across the country are ‘settling’ for less-desirable properties due to supply shortages,” he said. “As a result, properties in secondary locations with fewer amenities continue to be occupied when they would most likely remain vacant in other market cycles.”
Largely due to the pandemic, supply chain disruptions have spurred demand for such industrial properties, he said. At the same time, the supply of industrial property is having difficulties keeping up with demand.
Joe Santaularia, senior vice president and managing partner of Bradford Commercial Real Estate Services/CORFAC International in Dallas, agreed with Capitani that the pandemic solidified the strength of the industrial market, even as other asset classes including office, retail and hospitality took a massive blow. Both said they believe the market will remain competitive as interest rates increase.
“The rise in interest rates and construction costs will continue to make it difficult to make economic sense of speculative industrial development,” Capitani said. “Although some companies are forced to build rather than lease or buy existing properties due to specific needs, the cost-effective approach is to acquire existing properties.”
As a result, Capitani anticipates that vacancy rates will remain low and property values will continue to increase. Santaularia said rents will rise for properties below 300K SF, but will stagnate for space above this threshold.
Other trends that will remain dominant in 2023 include the process of reshoring in addition to retail space conversion and co-warehousing, Santaularia said.
“The main objective of reshoring is to ‘de-risk’ a company’s supply chain and bring operations back from Asia to the U.S. and Mexico,” he said. “This emerging trend in the industrial space has the ability to strengthen the economy, create jobs and help reduce production costs.”
On the same note, Santaularia said that warehousing companies are beginning to partner with occupants to fill unused space with users looking for short-term or bulk warehouse space.
“Co-warehousing is becoming more frequent throughout the industry as companies like OLIMP and Warehouse Pro are taking advantage of this concept,” he said. “When it comes to retail space conversion, industrial players are leasing assets usually considered retail in order to be closer to consumers. This will help them break up their footprints and lease multiple locations rather than just focusing on one market.”
Looking to next year, the two experts agreed that the need for industrial space will not be affected by many of the outside factors that impact other sectors. For instance, the office market is struggling to figure out its identity as landlords and tenants sort out the true meaning of flex work as it relates to space needs, and retail continues to gauge demand for brick-and-mortar locations in the online world.
They predicted supply and demand will continue to positively reinforce the industrial market for the foreseeable future.
“There has been very little speculative development of industrial products while the demand for manufacturing and distribution space has not abated,” Capitani said. “This trend will continue as interest rates and construction costs continue to rise, which will continue to drive down vacancy rates and increase industrial real estate values. Overall, we’re confident about what next year has in store for this market.”
Thank you to www.bisnow.com for this article. To read more, click here!
For Additional Blog Content, Click Here!
Mortgage Rates and Home Prices Favor Buyers—but How Long Will This Christmas Miracle Last?
 Christmas has arrived early for America’s homebuyers! And it’s not just one gift, but two that should make them giddy.
Gift No. 1: lower mortgage rates, which have been falling for the past four weeks.
“Housing data in the week that followed the Thanksgiving holiday showed that the recent dip in mortgage rates may already be having an impact,” explains Realtor.com® Chief Economist Danielle Halein her weekly analysis.
Gift No. 2: Home price growth “slowed notably” for the week ending Dec. 3, according to Hale.
We unwrap the latest real estate statistics and what they mean for homebuyers and sellers in our weekly column “How’s the Housing Market This Week?”

Mortgage rates dipped again
Not too long ago, it had been a grim picture: Mortgage rates had more than doubled over the past year and reached a 20-year high of 7.08% for a 30-year fixed-rate loan in late October.
Yet since then, for the past month, rates have been in a free fall, hitting 6.33% for the week ending Dec. 8, down from the previous week’s 6.49%, according to Freddie Mac.
Even this singular one-week decline comes with major savings on a typical house, amounting to $185 saved per month.
Yet with rates in flux, there may be little time for home shoppers to waste.
“With far more consumers still generally expecting higher rates rather than lower rates, those hoping to make a purchase may have some urgency to capitalize on what may be a temporary dip,” warns Hale.
Home price growth is tapering off
In November, the median price of a house hovered at $416,000. Yes, that’s high, but nowhere near the record high of $449,000 in June.
Furthermore, although the cost of a home has grown by double digits year over year for the past 49 weeks straight, the good news for homebuyers is that this growth is steadily ratcheting down.
For the week ending Dec. 3, the median listing price grew by 10.3% compared with the same week last year. So prices are still higher than a year earlier, but this was a steep decrease from the prior week’s growth rate of 12.2%.
And if the slowing continues, home price growth could move back into single-digit territory before the end of the year, giving buyers even more purchasing power.
Where are all the new homes?
While homebuyers might be thrilled by these sudden good tidings on the mortgage and home price front, the downside is that they’ll have fewer fresh listings to shop.
For 22 consecutive weeks, the number of new home sellers willing to list has dwindled, dropping for the week ending Dec. 3 by 8% compared with this same week last year.
Yet the silver lining is that this is the smallest decline since July.
And overall, the total number of homes for sale—both new listings and old—shot up an eye-popping 53% compared with one year ago.
This spike in overall homes for sale is largely a result of homes spending more time on the market. For the week ending Dec. 3, home shoppers had nine more days to scroll through listings compared with the same time last year.
“Homes are sitting on the market for longer, as buyers take their time to decide,” says Hale.
Buyers may need to act quickly
While lower mortgage rates, tapering home price growth, and more properties to choose from are all excellent news for homebuyers, there are still plenty of challenges and unknowns looming in 2023.
“Affordability continues to be a challenge compared to a year ago,” says Hale.
Home shoppers eager to make the most of their sudden boost in buying power should look to Northeast and Midwest markets for well-priced, affordable homes.
“Looking ahead, we expect midsized markets that offer affordability and are home to a mix of domestic manufacturing, government, health care, and education employers to have some of the top housing markets of 2023,” says Hale.
Thank you to Realtor.com for this article. To read more, click here!